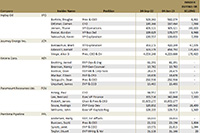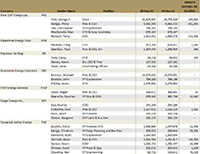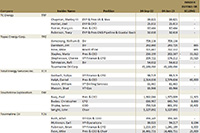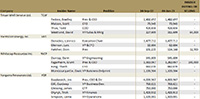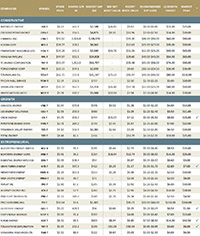

| VALUE | + | SENTIMENT | + | TECHNICALS | = | OVERALL |
|---|---|---|---|---|---|---|

|
|

|
|
|||
|
|
|

|
|
|||
|
|
|
|
|

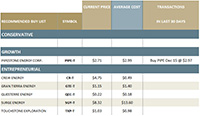
Green Light to Buy
Cheap valuations, Sentiment not bullish, Technicals very attractive

Yellow Light for Caution
Some wavering on parameters, or parameters not clear. Some stocks may be attractive, others not so

Red Light to Stop or Sell
Parameters bearish, stay away, sell down, warning to wait for the next buy signal

Click here to launch the Research Process in another tab for detailed definitions and checklist items