Report Navigation
Free Previews are abridged to help users get a feel for Josef’s newsletter and the topics it contains. The navigation below is deactivated, and excerpted sample content has been added below. Full content is available to subscribers – subscribe today!
1. Quarterly Reports
Review Of 16 Companies’ Q4/22 And Year End Results.
2. Company Lists
Covered Companies & Valuation Analysis. Company Links.
3. Action Alert Lists
Action Alert Performance Reports, & Action Sell Lists.
4. Disclosure List
SERSI & Family/Staff Ownership Disclosure.
Important Update
Welcoming Comments
The cut-off date for this SER report’s data was Friday March 9, 2023.

Josef Schachter
@lysle_photography
For those who remember the song with the lyrics “shake it up baby,” last week was a roller coaster of news and was very impactful for financial markets. When Fed Chairman Powell spoke before Congress last Tuesday and Wednesday and spoke hawkishly of the need to fight inflation and be ready to raise interest rates higher and faster (Chart #1) if the economic strength and inflation persisted, interest rates rocketed higher. The yield on 2-Year US Treasuries rose from a low of 4.06% in mid-January to a high of 5.05% last week. This is the highest rate for this term since 2007 just before the Global Financial Crisis (GFC). But wait, on Thursday and Friday rates plunged 45 BP as two US banks failed and were taken over by the FDIC (more on this later in this section). The flight to Treasuries is a normal reaction as market fear develops and investors take money out of the stock market or from financial institutions that they are concerned about.
Early last week there were two schools of thought with very divergent views of where interest rates are headed. Those looking at the economic data and see persistent inflation, anticipate the FOMC lifting the Fed Funds rates by 50 BP at their upcoming meeting March 21-22 and by more than 100 BP over the next few meetings. The divergent view is that the systematic stress on the financial industry that claimed two banks last week will force the Fed to pivot and lower rates at the upcoming meeting by 50 BP as they fear facing a newer version of the 2008 GFC (Global Financial Crisis).
We are not clairvoyant enough to call this one but either way, the next few weeks will be of historical note and will see a lot of financial pain for those offside the markets.
The stock market did not take Powell’s testimony or the two bank failures without severe downside pressure. Just during last week the Dow Jones Industrials Index fell 1,800 points from 33,600 to a low of 31,800 before closing at 31,909.
We had mentioned in past reports that support for the market was 32,600, so the market plunge last Thursday and Friday sliced like a hot knife through butter and the support levels were easily breached (Chart #2).
Now that the market has broken down and we have gone from ‘complacency’ to ‘fear’ we expect the market to decline into the end of this month to the next line of technical support which is at the October 2022 low of 28,700.
The reasons to expect a continued market onslaught for the next few weeks are:
- The Fed still has some key data points that, if too robust, would reignite fear of higher interest rates. Those are CPI, Retail Sales, PPI and Industrial Production which all come out before the FOMC meeting on March 21-22.
- The failure of two regional banks last week and the harsh decline in many of these stocks brings up the issue of bank contagion. Investors fear that more banks may be affected by bank liquidity – bank run concerns (more on this later). Memories last week went back to the GFC and the take-under of Bear Stearns, and the collapse of Lehman.
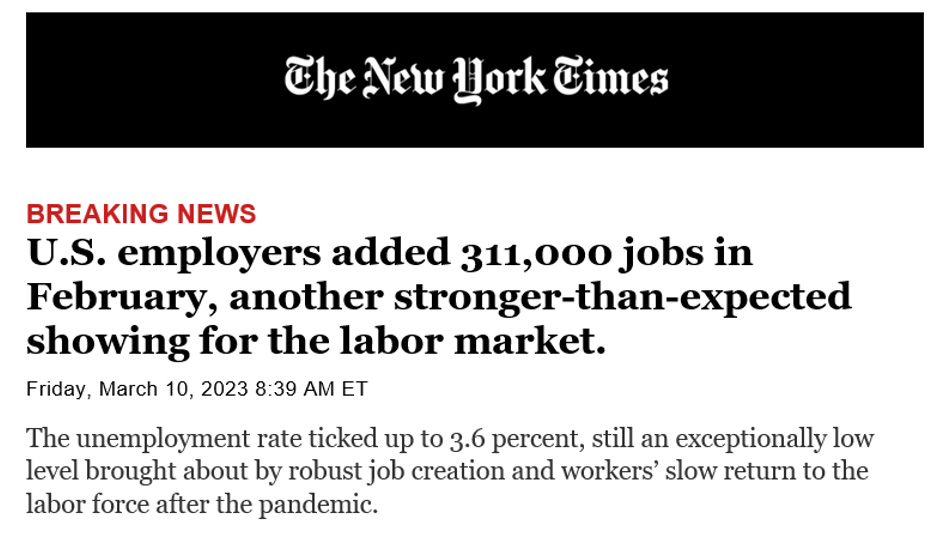
The economy remains hotter than consensus and if this persists than the Fed will be forced to be more aggressive in the fight against inflation. Friday saw one example with the February jobs data showing a rise of 311,00 jobs versus the forecast of 225,000 more jobs (Chart #3).
The job rise came from areas with low wage rates. Leisure and hospitality added 105,000 jobs, health care added 63,000 jobs and retail added 50,000 jobs. As a result the closely watched average hourly earnings data showed that wages rose by 4.6% above last year, shy of the consensus of up 4.7%.
Charts in the subscriber newsletter are full sized. Thumbnails shown here only for reference.
Chart #1
Fed is Prepared to Speed up Interest Rate
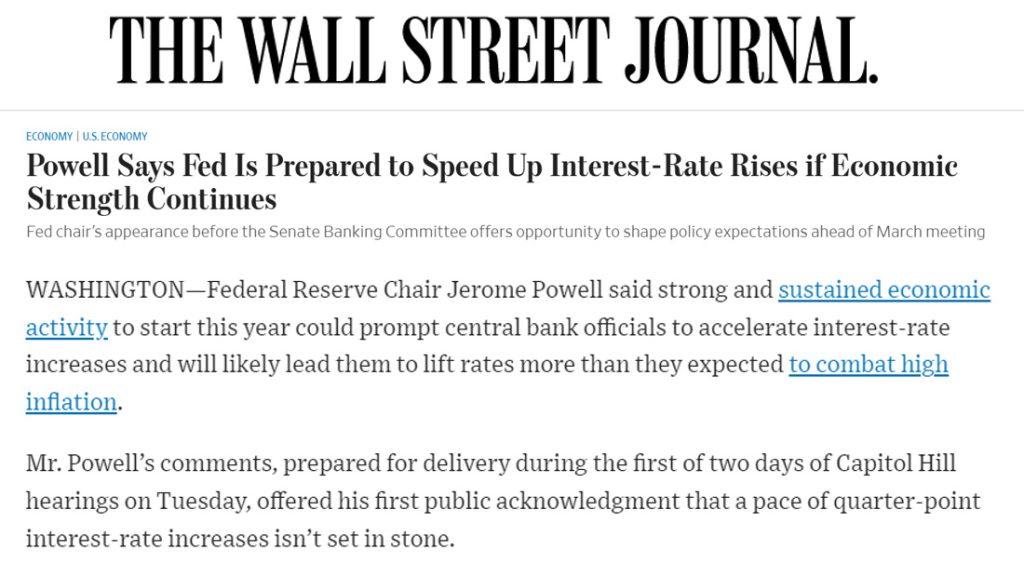
Chart #2
Dow Jones Industrials Index – Daily
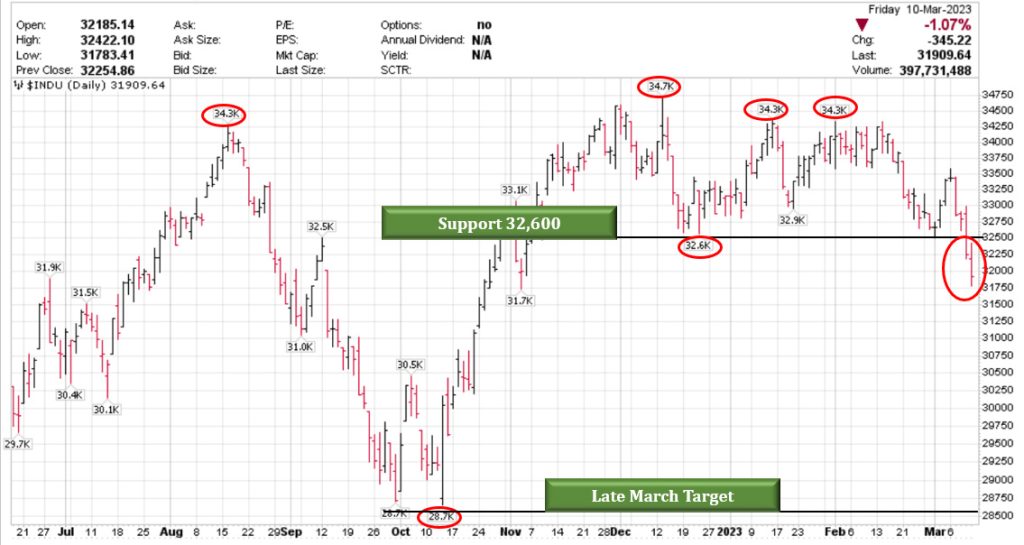
Chart #3
US Employers added 311,000 jobs
On the other side, the end of last week was highlighted by a run on a large California bank, Silicon Valley Bank (SVIB). The bank (the 16th largest in the US) started to have its depositors needing money to make payroll or other expenses, and it was forced to sell its liquidity assets of US Treasury securities that it had bought when large flows of money had come in from Venture Capital raises, SPAC money, and underwritings that could not be put to use right away. Their website showed that they dealt with nearly half of all VC (venture Capital) firms and with 44% of US venture backed tech and health care companies. A very concentrated portfolio.
So they bought US Treasuries thinking they were risk free. The problem is that they are not without liquidity delays and with interest rate product they bought having maturities of six months to a year, there were large losses than had to be triggered to free up the funds needed by their customers. That haircut was US$1.8B in just a few days as they sold US$21B of US Treasury securities. If the run on deposits had not occurred they could have held the assets to maturity and taken no losses. However as word got out about its problems more customers pulled deposits and the bank run was on.
Today bank runs are not people lining up to withdraw funds as was seen in prior financial crises but this time it was one key stroke on a computer and the funds went from SVB to whichever money center bank that the customer also used. The speed of withdrawals was faster than the ability to raise new capital. In the end the stock did not open on Friday and the FDIC took it over (Chart #4). The magnitude of its market share in the Silicon Valley area was 26% of local deposits so this will hurt the area for some time until all the assets are sold and depositors get access to more than the US$250,000 that is FDIC insured and nearly immediately accessible.
Canadian companies that raised money with VCs in the Bay area may be vulnerable as the VCs wanted to keep an eye on their cash and not have it moved to Canada until needed. Last weekend some of those impacted started to release the unfortunate details.
Silicon Valley Bank had been around since 1983. They opened their first branch in San Jose and later, in 1985, the office in Palo Alto. It was the bank of the venture funds and those receiving the financial support. It has assets of US$209B before the run started. It was the bank for start up wizards and was where their VC backers wanted the start ups to bank. This now becomes the second largest bank failure in history. The largest remains Washington Mutual which failed with US$307B in 2008.
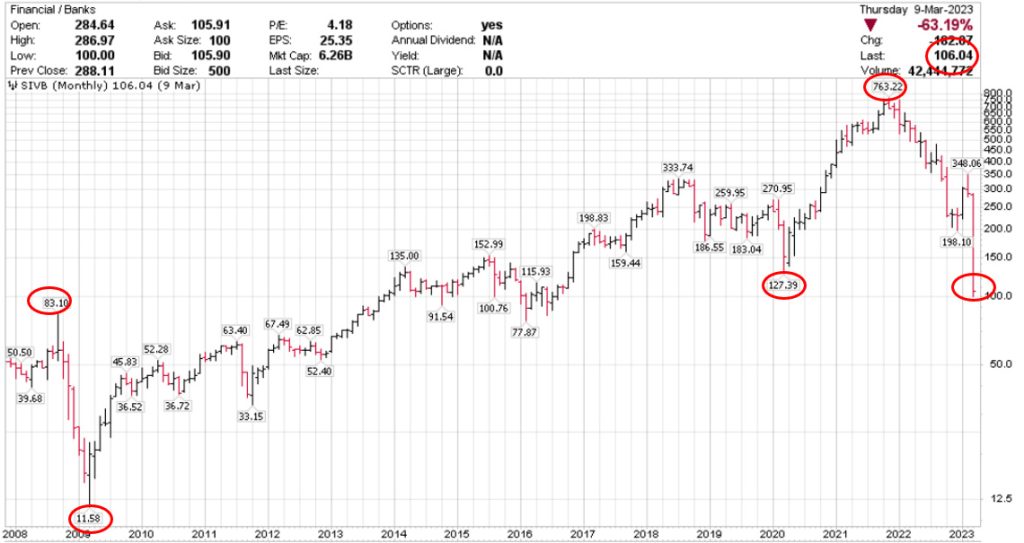
SVB’s stock had fallen with the market correction over the last year as tech stocks got wrecked. SVB peaked at US$763 per share and with 59.2M shares outstanding had a market cap at its peak of US$45B. The stock closed Thursday at US$106 per share (Chart #5) and the pre-market on Friday was for an opening price of US$39.40 per share before the FDIC took it over and the shareholders equity was wiped out.
With the two bank failures (the other was Silvergate Capital – US$120B of assets and considered the crypto bank) and fear of more banks facing liquidity problems, the move by the Treasury and the FDIC was quickly implemented to stop the contagion fear over the weekend. Treasury personnel and regional banks will move to buttress their balance sheets and liquidity provided. The best result for depositors is if the FDIC provides support to a stronger bank (likely a major US player) to take SVB over as was done by the Treasury when Bear Stearns was taken over (or more accurately taken under) by J P Morgan Chase (JPM – N) with support of the US Treasury department.
This is a dire situation. If a deal is not done and the FDIC continues to hold the bank under their auspices, it becomes very challenging for companies to pay expenses including payrolls which in turn becomes a problem not just for corporate boardrooms, but a problem at kitchen tables of employees not getting paid and having daily expenses. This is when the hurt becomes very real.
Charts in the subscriber newsletter are full sized. Thumbnails shown here only for reference.
Chart #4
SVB under GOVERNMENT control
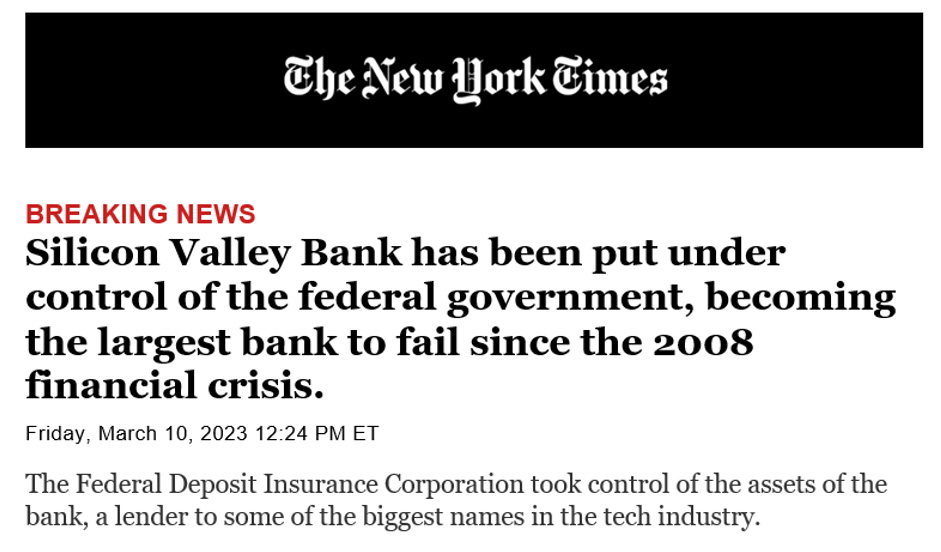
Chart #5
Dow Jones Industrials Index – Daily
The market is now in a downdraft phase that will not be comfortable for investors. Last year the MEME, FAANG, SPAC and TECH wreck hurt portfolios and this year is continuing with the financial sector getting hit. These market plunge phases are painful but over quickly. I expect that later this month there will be bargains across the market offerings.
Regarding energy there are many stocks we cover that are now in our BUY ranges. We have held off adding new names to our Action BUY list as we wait for any of the four sector BUY signals to be triggered. As of last Friday the one that may trigger first could be the S&P Energy Sector Bullish Percent Index. It was at a high of 78% bullishness at the beginning of 2023 and was at 43% at the beginning of last week. It fell to 26% last Friday, so in one week a 17 percent point decline. Our BUY signal gets triggered below 10% bullishness. I expect we are going to be sending out new BUY ideas via Action Alerts in the near term.
In this issue of the SER report the main portion is the coverage of 16 companies that have reported Q4/22 and annual results. In our last issue we covered five companies so we have 16 left for the next issue which will come to you on March 30th.
Most of the companies have greatly improved results and their stocks are within or just above our BUY range. When we send out the Action BUY ALERT with new additions to the Action BUY List you can move expeditiously to move your cash on the sidelines into great ideas at bargain prices.
CONCLUSION
To Buy or Not to Buy
| VALUE | + | SENTIMENT | + | TECHNICALS | = | OVERALL |
|---|---|---|---|---|---|---|

|

|

|

|
|||

|

|

|

|
|||

|

|

|

|

Green Light to Buy
Cheap valuations, Sentiment not bullish, Technicals very attractive

Yellow Light for Caution
Some wavering on parameters, or parameters not clear. Some stocks may be attractive, others not so

Red Light to Stop or Sell
Parameters bearish, stay away, sell down, warning to wait for the next buy signal

Click here to launch the Research Process in another tab for detailed definitions and checklist items
1. Quarterly Reports
In this example issue, sixteen companies were profiled, which was the bulk of the content of the issue, spanning thousands of words of analysis and information. Details of the Quality Scoring Metrics are shared below.
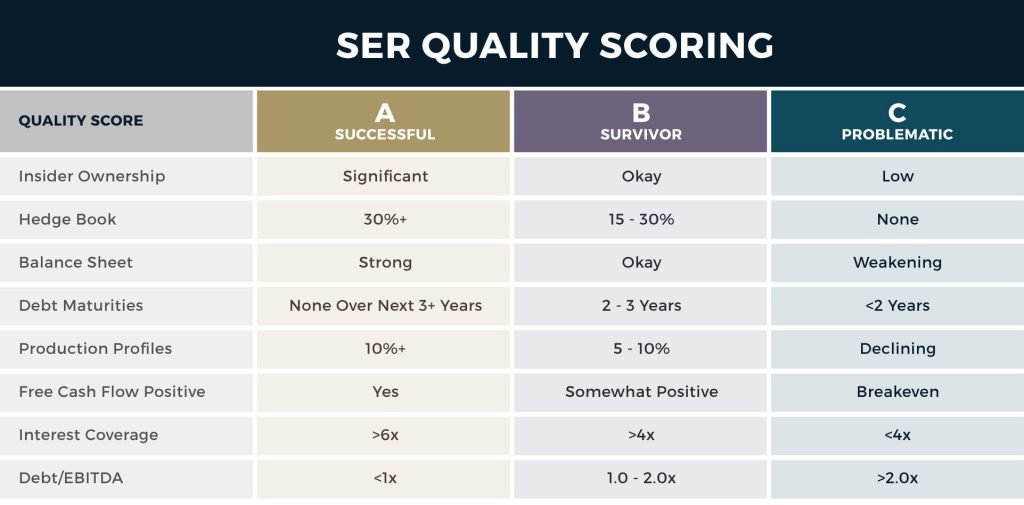
- Insider Ownership – The higher the better. If there is low ownership that is a negative and selling is watched carefully.
- Hedge books – Is the company a successful hedger? Has it added hedges given the war premium prices?
- Balance Sheet – Do they have positive working capital, is debt low versus equity and is the direction down versus rising at the current time?
- Debt Maturities – Do they have debt maturing in the next year or so? Do they have capability to roll it over or extend?
- Production Profiles – Are they going to see production grow 10&, have modest growth of 5-10% this year, or be flat to down?
- Free Cash Flow – Are they generating free cash flow to pay down debt, provide shareholder returns and improve their balance sheet?
- Interest Coverage – Is their coverage ratio better than 6x or between 4-6x or below 4x?
- Debt/EBITDA – Is the ratio less than 1x, below 2x or is it above 2x?
Each quarter, Josef attends company meetings to learn first hand about challenges and achievements. Through multiple issues of the Schachter Energy Report, each company on the coverage list is given an individualized reporting, including:
- Up-to-date Financials
- Analysis of Investor Communications
- Balance of Evidence
- Net Asset Value
- Weekly and Monthly Stock Performance
- Overall Valuation
- Conclusion with Forecast and Advice
The Schachter Energy Report Covered Companies are part of a proprietary subscribers-only list, and therefore only a high-level glimpse of these quarterly reports is possible.
Thumbnail screenshots of quarterly reports
Charts in the subscriber newsletter are full sized with additional context. Thumbnails shown here only for reference.




2-4. Lists
Charts in the subscriber newsletter are full sized with additional context. Thumbnails shown here only for reference.
Company coverage list
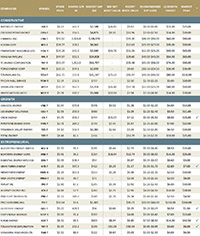
Valuation
list
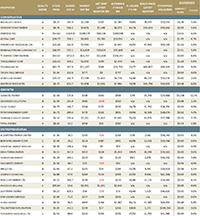
Action Alert performance
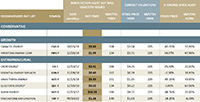
Action Alert performance
Disclosure chart
