
Global Economic, Political & Military Update
The US Stock market is in a material correction with the Dow down over 2,700 points since the early August high of 35,700, now at 32,940, and in negative territory for the year. The NASDAQ is down over 1,300 points from its high at 14,447 in mid-July, now at 13,135. Not yet the 10% for an official ‘correction’ but getting very close. Before this downside pressure is over during Q4/23, we expect the key US indices to fall >20%. Caveat Emptor!
Some of the positive and negative issues facing the US are:
- The debacle of firing the Republican Speaker of the House has now thrown the 45 day CR out the window and the budget battle will only restart once a new Speaker is chosen. When this process starts is unknown. To get elected, if the next Republican needs Democratic support, the issue of what they get in a power sharing deal will just add to the crisis of governing and getting legislation passed, and sent on to the even more glacially asleep Senate. Funds for the border and Ukraine are hostage to this political failure.
- The US needs to raise US$800B in Q4/23 of new funds to meet authorized spending (compared to US$400B in Q4/22). With higher rates now and nearing the 2007 levels across the maturity spectrum and with no expectation that China will buy US Treasury bonds (they had been the largest foreign buyer) with the current tensions, China has turned to be a seller. At its peak in 2013 China held over US$1.3T and now holds US$822B having sold US$493B of which US$300B has been sold in the last two years. Only Japan has been a buyer but of lower amounts, so the US needs natural domestic buyers and this is causing a crowding out effect. Where does the money come from to buy this paper? Companies that need debt financing will have to compete with the Treasury. Rates are rising quickly and this is lifting the US dollar which will impact earnings of companies with large international businesses. Mortgage rates are nearing 8% which has slowed housing transactions and is impacting the price of housing due to the lack of affordability at current rates. We expect a significant increase in foreclosures in the coming months. Is this 2008 once again?
- Banks that bought US Treasury bonds in the last few years, when interest rates were much lower, are sitting on horrendous losses. If they don’t trigger the losses and keep them to maturity then they will halt or slow lending, adding to pressure on the economy. The losses are reported at US$550B so far and with rates still rising this just gets worse. This is roughly 25% of total bank capital.
- A Canadian example, RBC which owns City National Bank with a big presence in California was forced to inject more capital and take some of this bank’s debt onto their books because of the outflow of low cost deposits. Deposit outflows continue and those without a big brother may be in jeopardy.
- Union action is spreading from the auto sector to now the health care sector. A coalition of unions representing 75,000 workers have started a three day walkout that may impact 13 million people. The union wants 6.5% raises in the first two years of a new contract.
- Q3/23 earnings start flowing next week and if the numbers fail to meet targets or guidance is muted then the current decline in stocks could turn into a plunge. Our target of below 30,000 for the Dow this month remains.
- Both the equity and bond markets are jittery but it appears that the bond area is seeing more volatility and nervousness. Not a good sign for markets this month.
For the rest of the world no new important economic data for this report.
The war in Ukraine is seeing more escalations as one side ups the ante on the other. This has spread to more accurate daily drone attacks on Moscow and Crimea by Ukraine and the Black Sea Ukrainian export ports attacked by Russia.
Some recent events:
- Many NATO countries’ militaries are bemoaning the fact that their munitions levels are bare and that replacing the stocks could take years once funding is approved. Many are leery of sending more when they need the goods for training and for minimally acceptable levels. Canada’s military has said their shelves are bare. The US is nervous about potential needs in Asia if China moves on Taiwan.
- The fiscal pressure on NATO countries is also a pressure point. The US has given nearly US$100B and NATO US$88B of military and economic aid.
- The recent election in Slovakia was a win for pro-Russian parties. Robert Fico and his anti-Ukrainian war party SMER is working to form a new government and plan to end providing military aid to Ukraine. This is a win for Putin and the first crack in NATO.
- Ukraine used new equipment provided by NATO and destroyed Russia’s top end S-400 anti-air systems. They are now receiving nuclear tipped munitions. A nasty escalation.
- The UK did a reversal of the Secretary of Defense’s comments about sending UK troops to train Ukraine in Ukraine. This did not stop articles about UK special forces already fighting and dying in the country. West Germany appears to have lost tank troops training Ukrainians to use their Leopard tanks but no official confirmation has been made by Germany. Likely, they will say they were foreign volunteers just like the US does.
- Russia yesterday completed their first nationwide nuclear attack exercise across 11 time zones. It may be a warning that Moscow wants restraint from NATO and particularly the US from giving Ukraine longer reach weaponry. Russia has 16,000 nuclear shelters so this is a big deal. The US in comparison only has one in the Seattle area.
- Russia is calling up 130,000 more conscripts and increasing the age from 27 to 30. They seem to be preparing for a long war.
Market Movement: We have warned about a breach of the 33,600 level for the Dow (today at 32,940), which completes a topping formation for the Dow. A close below 32,600 would set up the waterfall decline phase to below 30,000. Stay patient with cash reserves. We have harvested some of our currently held positions with very nice profits. We are however keeping core weightings in each name. Subscribers please check the SER Ownership releases to see what we have done via our partial harvesting.
Once this correction has lowered stock prices and fear has returned to the markets over the coming weeks, be ready to buy the bargains that develop. As the general stock market declines we expect energy prices to back off and the Energy Bullish Percent Index to retreat back to below 10% and ring the bell for the next BUY window. The last BUY signal was in March and we added 14 new ideas to our Action BUY List. Many energy stocks are down from their 2022 highs, and many trade around Proved Developed Producing (PDP) Reserve valuations levels. If you want to see what our subscribers are looking at, sign up now for access to the Schachter Energy Research reports.
BULLISH PRESSURE
Some recent bulls have called for US$100/b oil in the coming weeks and we are now seeing some bulls calling for US$150/b in 2024. Commodity and hedge fund speculators recently were near record long positions as they spiked up prices and emphasized the supply cutbacks from Saudi Arabia. They have now sold off some of their net long positions that reached 286MB last month (in June they held less than 60 MB) as prices have eroded. They have reduced longs by 25 MB over the last week, according to Reuters, but still are overly long.
BEARISH PRESSURE
The Urals discount has shrunk as more buyers want some discount to Brent crude India recently has been paying a 30% price above US$$60/b - the sanction lid price, or around US$80/b. Russia’s economy remains healthy and has exceeded the expectations of the west.
Venezuela is seeing a ramp up of production from new drilling and field work by Chevron. They expect to add 65 Kb/d to their current level of production (135 Kb/d, a 70% increase from 2022) once their current activity is completed. Overall, Chevron expects to add 200 Kb/d by the end of next year since they got the OK from the US and Venezuelan governments. Overall exports in September reached 800,000 b/d. Most is going to China but 85,000 is being sold to its top political ally in the area, Cuba at significant discounts.
EIA Weekly Oil Data
The EIA data (data cut-off September 29th) was clearly bearish for crude prices. Commercial Crude Stocks fell 2.2 Mb to 414.1 Mb but was down due to Net Imports falling 1.96 Mb/d or 13.7 Mb on the week. The SPR saw an increase of 0.3 Mb to 351.3 Mb. Motor Gasoline inventories rose 6.5 Mb while Distillate Fuels saw a decline of 1.3 Mb/d. Total Stocks (excluding the SPR) rose 4.6 Mb to 1,271.7 MB or 66 days of consumption (and up three days from last week). Refinery Utilization fell 2.2% to 87.3% as the fall maintenance season is underway. US crude production stayed steady at the yearly high of 12.9 Mb/d. Production is up 900 Kb/d above year ago levels, as longer reach horizontal wells are producing more. Cushing inventories rose 0.1 Mb to 22.1 Mb. Motor Gasoline consumption fell by 606 Kb/d to 8.01 Mb/d. Jet Fuel saw a rise of 76 Kb/d to 1.71 Mb/d. Total Demand fell 984 Kb/d to 19.16 Mb/d as Other Oils demand fell 592 Kb/d to 4.55 Mb/d. Total US consumption is below last year on a year-to-date basis by 0.7%. Consumption was at 20.14 Mb/d versus 20.29 Mb/d last year. So overall a report not supportive of higher crude prices as US demand wanes.
EIA Weekly Natural Gas Data
The EIA data released on September 28th was bullish for natural gas prices as it showed a build of 90 Bcf for the week ending September 22nd as electricity demand remains strong given the current heat wave. Storage is now at 3.36 Tcf. The biggest increase was in the Midwest (31 Bcf). This compares to the five-year injection rate of 72 Bcf and the 2022 injection of 103 Bcf. US Storage is now 13.4% above last year’s level of 2.96 Tcf and 6.0% above the five year average of 3.17 Tcf. NYMEX is today priced at a very healthy US$3.05/mcf. Texas is worried that it may not have enough peak power so it’s trying to lock up around 3,000 megawatts of additional power during the worst of winter.
Our forecast is for NYMEX to rise above US$3.50/mcf in the coming weeks as colder weather arrives. NYMEX should rise to over US$4.50/mcf during winter 2023-2024. Europe should see tightened supplies this winter and if winter is colder than last year should lift prices materially. We recommend buying the very depressed natural gas stocks during periods of general market weakness. We intend to add additional natural gas names to our Action BUY list when we get the next low risk energy BUY signal.
Baker Hughes Rig Data
In the data for the week ending September 29th the US rig count fell 7 rigs to 623 rigs (down 11 rigs last week). Rig activity is now 19% below the level of 765 in 2022. Of the total rigs working last week, 502 were drilling for oil and this is 17% below last year’s level of 604 rigs working. The natural gas rig count is down 27% from last year’s 159 rigs, now at 116 rigs. The natural gas focused Haynesville now has 39 rigs working down from 71 rigs working last year or down by 45%. Natural gas supplies could fall 2-3 BCF/d by year end due to the lack of drilling and demand should pick up once annual maintenance is completed at key LNG facilities and winter demand ramp up.
In Canada, there was a one rig increase in the rig count (no change last week) to 191 rigs. Canadian activity is down 10% versus last year when 213 rigs were working. Activity for oil is down 20% to 115 rigs compared to 144 last year. Activity for natural gas is 10% at 76 rigs up from 69 last year. The main focus on natural gas drilling has been on the liquids rich condensate Montney and Duvernay plays.
Catch the Energy Conference Update:

Tickets are on sale to the public. Become a subscriber and get two free tickets to the conference (tickets to the public are on sale at $179 each currently so the above deal is a very attractive one for attendees and those interested in trying out our research). To find out more go to www.catchtheenergyconference.com.
We anticipate being sold out by Friday so if you want to be able to attend please get your tickets right away.
Our Premier, Danielle Smith will open the conference. This plenary session will take place in the Bella Concert Hall starting at 8:30AM. Registration is in the Roderick Mah Centre of Continuous Learning Conference Center and starts at 7:30AM. Breakfast will be served in front of the Bella Hall at 8:00AM.
Thank you to our Sponsors, Exhibitors and Presenters. It is going to be a great lineup this year!
Here is our conference schedule for now.
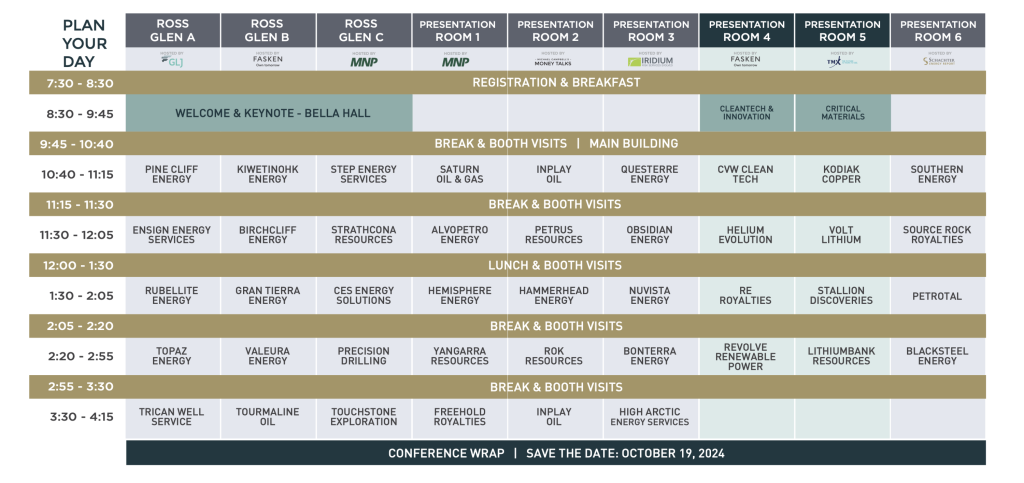
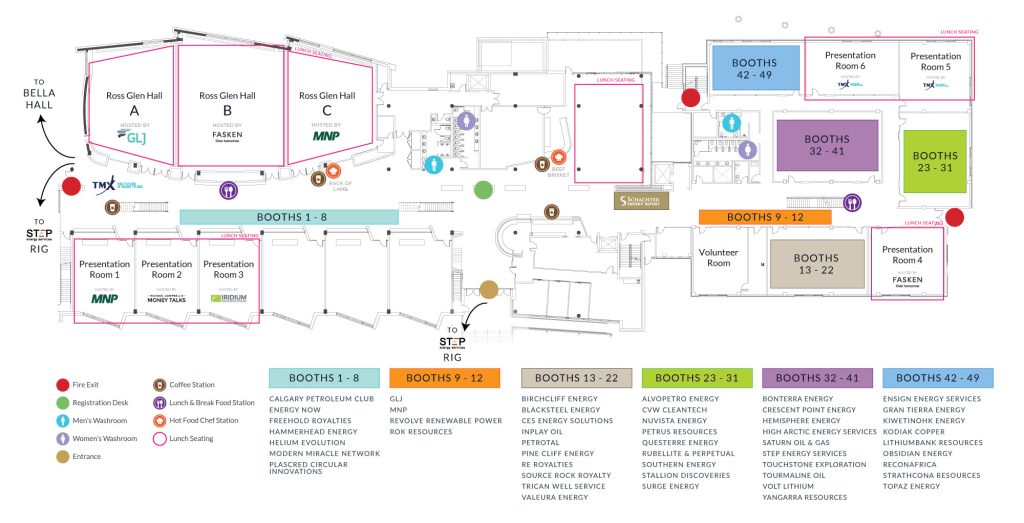
Our floor plan for the Presentations starting at 10:40AM with nine rooms running and five presentations slots has the attached Roderick Mah Centre Layout.
Energy Stock Market
The S&P/TSX Energy Index today is at 254, down 17 points from last week on the severe fall in crude prices over the last week. As the general market decline continues and the Dow Jones Industrials breaches 30,000, we expect the S&P/TSX Energy Index to fall below 220, only 24 points away. This would trigger another key BUY signal for us. Get your BUY List ready!
New BUY ideas will be issued as energy stocks fall into our BUY ranges. Decide what you want your energy weighting to be for this long energy super cycle. Our Coverage List includes ideas from the Pipeline & Infrastructure area, Canadian oil and natural gas ideas, energy service ideas and companies working internationally. Our list includes large Conservative ideas and small to large caps in our Growth and Entrepreneurial categories. Add to your current ideas or add new ideas when we send out the next low risk entry point recommendations. We expect that WTI should lift and stay above US$90/b during winter 2023-2024, as winter demand recovers and demand should clearly exceed supplies.
CONCLUSION
WTI is priced today at US$85.23/b down nearly US$10/b from last week’s high of US$95.03/b. As the stock market retreat continues we should see WTI crude get dragged down further, falling below US$80/b this month. Even lower levels are possible if China’s difficulties get a higher profile. As markets retreat we expect to take advantage of the bargains in energy stock prices. More BUY ideas will be added to our Action BUY List when we get the next low risk BUY window. Down market days during that time are the best days to build your positions for the lengthy energy super cycle we see lasting into the end of the decade.