Report Navigation
Free Previews are abridged to help users get a feel for Josef’s newsletter and the topics it contains. The navigation below is deactivated, and excerpted sample content has been added below. Full content is available to subscribers – subscribe today!
1. stock Market Overview
Overhead and with Likely Downside.
2. Energy Market Update
Crude Oil and Natural Gas.
3. New Company coverage
Introducing Coverage.
4. Company Updates
Major Company Change.
5. Company Lists
Covered Companies & Valuation Analysis. Company Links.
6. Action Alert Lists
Action Alert Performance Reports, & Action Sell Lists.
7. Disclosure List
SERSI & Family/Staff Ownership Disclosure.
Welcoming Comments
The cut-off date for this SER report’s data was Thursday, January 24, 2024

Josef Schachter
@lysle_photography
Since the high in October 2023, the S&P/TSX Index has fallen from 278 to a low last week at 233 for a decline of 16%. Our view has been that there would be one more decline below US$70/b for WTI crude oil as there are sufficient supplies and that the S&P/TSX Energy Index would decline below 230 and bottom in the next few weeks below 225 (bottom range 220-225). This remains our view.
However, not all stocks bottom at the same time. So, whenever we have seen energy stocks retreat to bargain levels, we have recommended starting new positions from our SER BUY List or adding to attractive ideas already held. We have done so for ourselves as you can see from the SER Ownership page in our Lists section. We added to our Birchcliff, Surge and Touchstone positions during January. During down market days is the best time to BUY as you can place bids in below the market price, and they will likely get filled.
The expected decline for the general stock market should be significant and the high beta energy sector will not be immune to this downthrust. Of import is that in 2024 we see the reverse of 2023, with the general market getting hit this year and the weak energy sector of 2023 having a great year. Our forecast of over US$90/b in Q4/24 should provide upside in the energy index to the 280 level (now 239). From the expected near-term low of 225 the index upside would be 24%. Given the large weight in this index of Suncor, CNQ, Cenovus and Imperial Oil which should underperform, the ideas we cover from the E&P and energy service sector should do much better. Many of the E&P and energy service ideas on our SER BUY List could see appreciation of 50% or more by the end of the year.
When the AI craze deflates and there is significant fear again in the market amid a material correction, we plan to add five or more new BUY ideas to our Action BUY List. We have gone from a cautious stance in early 2023 with only eight BUY ideas to 22 companies after sending out two Action BUY Lists in mid-March with seven BUY ideas each time. In December we added seven more BUY ideas when the price of crude fell below US$70/b, which was one of the BUY signals we were waiting for. If we see erosion in the sector during late January or February, we plan to add five more BUY names, then we will have majority of the companies we cover on our BUY List. We now have 25 BUY ideas after losing a few companies to takeover activity.
In this issue we are introducing coverage on one new E&P company – Rubellite Energy that has exciting growth potential and is quite cheap. The company has its head offices in Calgary, so access to management is readily available. Insiders are significant shareholders. The company has been a Presenter at the ‘Catch The Energy’ conference for the last two years.
The AI and tech craze and its technology have not yet become revenue generators for the buyers of the US$30,000 chips. Yet to get investor attention anyone saying they are moving into AI sees a big stock price jump. Doesn’t that remind you of the Dot-Com bubble when stocks rocketed higher on the number of eyeballs on the app, even though many of the companies had limited revenues?
Josef Schachter
Practical applications are a while away, maybe even years. Corporations that say that they are using AI are being rewarded as if they currently have applications for usage and are getting massive increases in revenues. Yes, the chip stocks like NVIDIA and AMD are seeing revenue increases but the buyers of their chips so far are not.
If companies claiming to be AI beneficiaries have seen their stock prices skyrocket, but they do not show material increases in revenues and profits in upcoming quarters – watch out. Caveat Emptor!
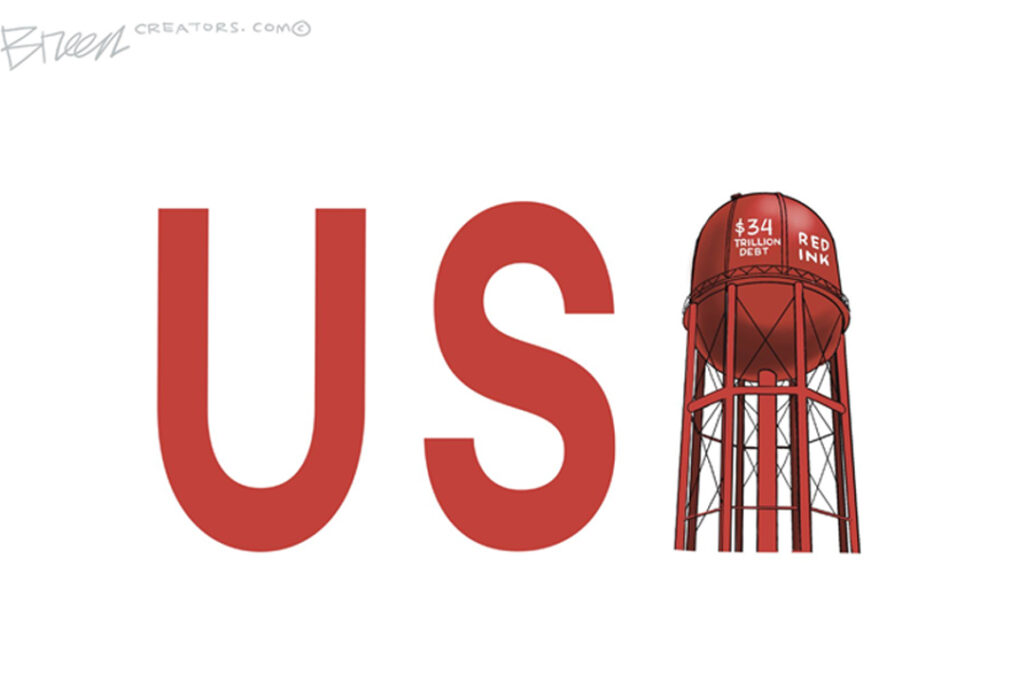
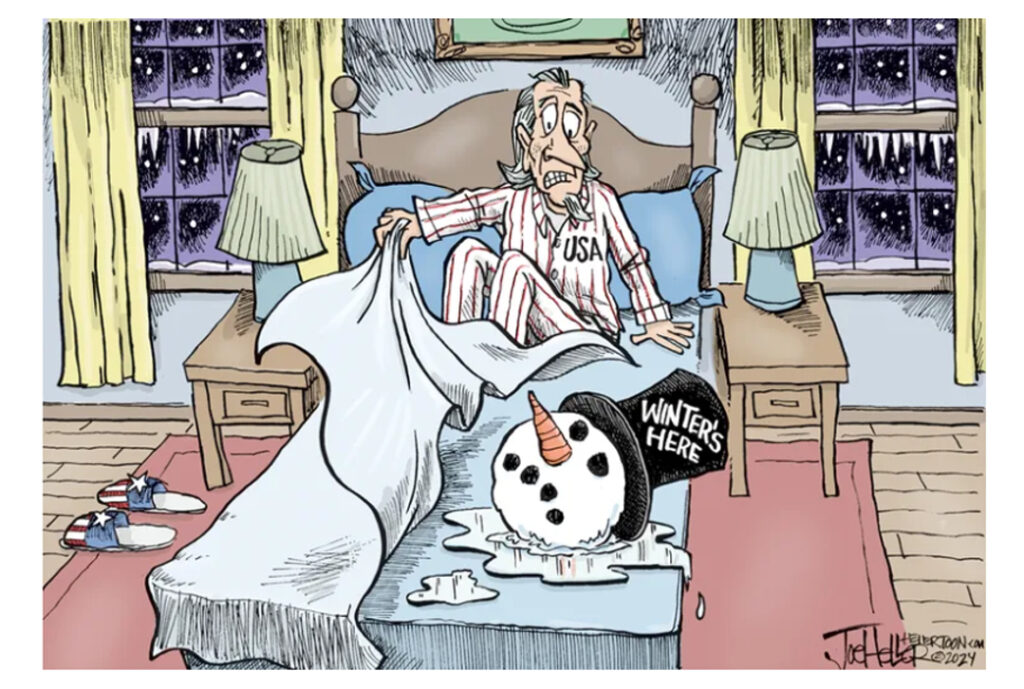
For Your Amusement
Challenging Issues
Source: theweek.com, January 2024




Josef Speaking Friday 6:15
Bayshore Hotel, Vancouver
World Outlook Financial Conference February 2-3, 2024
SER Covered Companies appearing at WOFC
To Buy or Not to Buy
| VALUE | + | SENTIMENT | + | TECHNICALS | = | OVERALL |
|---|---|---|---|---|---|---|

|

|

|

|
|||

|

|

|

|
|||

|

|

|

|

Green Light to Buy
Cheap valuations, Sentiment not bullish, Technicals very attractive

Yellow Light for Caution
Some wavering on parameters, or parameters not clear. Some stocks may be attractive, others not so

Red Light to Stop or Sell
Parameters bearish, stay away, sell down, warning to wait for the next buy signal

Click here to launch the Research Process in another tab for detailed definitions and checklist items
1. Stock market overview
Greed Rampant.
Greed is rampant in the stock markets. The CNN Greed & Fear Index (Chart #1) has lifted to a reading of 76 (an Extreme Greed level). We expect the AI focus will see their bubble burst and the large US indices will face a 20-30% downside during 1H/24.
REASONS FOR THAT STOCK MARKET TO MOVE TO THE DOWNSIDE:
- Disappointing earnings and guidance for many companies as Q4/23 results come out and guidance is negative.
- Inflationary pressure picks up in the wage and food areas holding the Fed and other Central Banks from lowering interest rates.
- More real estate problems for banks develop.
- AI does not show immediate benefit to the companies spending enormous amounts on this.
- Another phase of the banking crisis unfolds as more deposits leave regional and smaller banks which face significant bond holding losses and have over exposure to the very weak commercial real estate sector (empty office buildings).
- A new military event somewhere in the world adds to current war drums.
- US individual savings rates are depleted (Chart #2). Historically they have ranged between 2% and 3% but are now negative as individuals have used savings and credit card debt to keep up their standard of living. Many have taken part-time jobs to supplement their full-time job incomes as their household budgets have been squeezed.
- Excessive optimism bordering on “Irrational Exuberance”.
Another two data points reflecting the general stock market excesses are:
The S&P 500 is trading at nearly 8x the ratio to the MSCI World Index. Normally it is at 2x (Chart #3).
The S&P 500 Bullish Percent Index in December reached an overbought level over 80% (Chart #4) and has since declined to 71%. This action has been an early indicator of a change in direction for the market, like a canary in a coal mine. Every reversal has led to moderate or significant market declines. Note Q3/23, Q1/23 and twice during 2022.
China, the second largest economy in the world, is in disarray. Its economic growth rate has fallen sharply, consumers are husbanding their savings and the housing sector, where most Chinese focus their investment capital, has been severely disrupted as unfinished residential buildings mean loss of their significant deposits. Many of the real estate companies in China have failed and the bankruptcies have hurt individuals, corporate lenders, banks and local governments.
This is showing up in their overall stock markets.
The Shanghai Shenzhen CSI 300 is down 53% from the high of 2021 and down 24% from the high in 2023 (Chart #5). This decline continues in 2024.
Thumbnail screenshots of report charts
Charts in the subscriber newsletter are full sized with additional context. Thumbnails shown here only for reference.


This has spread to the Hong Kong market which is down 52% from the 2021 high and is close to the 2022 low (Chart #6).
The worst hit has been the property sector as mentioned above as can be seen from the Hang Seng Properties Index which peaked in 2019 around the 46,000 level and has declined into 2024 (a new low). It’s down in total by a whopping 66% (Chart #7). This much wealth destruction is taking a toll on China and makes a recovery difficult.
Inflation has not disappeared especially in food inflation. Some key commodities are rising and will impact prices at the food store in coming months.
My favourite fix will be more costly soon. I love chocolate and cocoa futures are rocketing higher. Just in recent months the price of beans has doubled (Chart #8). They have reached up to the highest level last seen in 1977. Expect dollars to be added to your favourite fixes over the coming months.
Coffee, my wife’s favourite morning fix has risen 46% since October of 2023 (Chart #9).
Corn and wheat inventories worldwide are shrinking and with the war zone in Ukraine (the breadbasket of Europe) plantings are not occurring. Going forward prices are likely to rise due to shortages and higher shipping costs as travel through the Red Sea can’t occur.
Uranium has been the darling of the metal’s exchanges from mid-2023. The price of U308 has risen 134% (Chart #10) and recently gone parabolic. Cameco, Canada’s uranium champion has risen nearly 6x from the low in 2020 and is up 130% since the beginning of 2023 (Chart #11).
So, parts of the commodity board are hot now and we see the energy sector joining this robust performance this year with the best part of the upside during 2H/24. We covered this view in our SER outlook report sent to subscribers on January 18th.
2. Energy Market Update
Use Upcoming weakness.
Thumbnail screenshots of report charts
Charts in the subscriber newsletter are full sized with additional context. Thumbnails shown here only for reference.
Our bullish thesis for WTI crude oil with a price rise to US$90/b during summer 2024 and exceeding US$100/b in late 2024 was discussed in our last SER issue.
An update on crude oil shows it trading on Wednesday January 24th at US$75.09/b (Chart #12). We covered our bullish outlook for the year ahead in our Outlook 2024 report, with the upside excitement coming during 2H/24. Our crude price forecast for 2024 shown in the SER 2024 forecast report is shown again in (Chart #13).
Use upcoming energy sector weakness to add to favourite positions. If we get a Table Pounding BUY signal from the S&P Energy Bullish Percent Index, if it falls below 5%, we recommend taking your energy weighting to whatever that full weighting is for your needs. Decide with your advisor what fits your financial requirements and risk tolerance and build your portfolio accordingly.
CONCLUSION
3. New Company Coverage
4. Company updates
5 - 7. Lists
We currently hold nine positions and continue to add to positions when they are bargains…
Of the nine positions we hold… has been the best performer.
We expect to add to all owned positions over time, to BUY other ideas on our current Action BUY List, and to add new positions after we send our new Action Alert BUYs and wait the requisite five business days.
For now, we will watch for the decline in the sector and wait for the next S&P Energy Bullish Percent BUY signal or any of our other key signals to be triggered. When the next one is triggered, we intend to add two to three additional ideas to our portfolios. We still hold some cash and defensive positions. We intend to put these reserves to work when the next low risk BUY signal arrives.
Patience and perseverance still required!
Reminder
Charts in the subscriber newsletter are full sized with additional context. Thumbnails shown here only for reference.
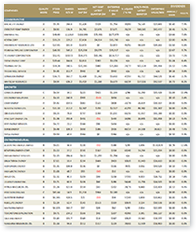
Company coverage list
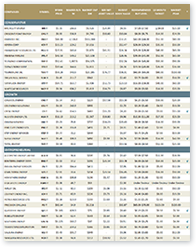
Valuation
list
Action Alert performance
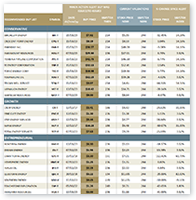
Action Alert performance
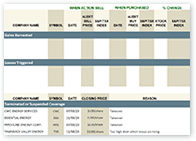
Disclosure chart
