
Important Update: Eye on Energy is Evolving
We have been publishing the weekly Eye on Energy as an extension of the Schachter Energy Report to provide timely and expanded insights on the Energy and World Market. Over time, the volume of information and the effort required to produce this report have grown significantly. As a result, we are transitioning Eye on Energy to a paid subscription model on Substack to ensure its continued quality and sustainability.
Free Access Until September 10, 2025:
Eye on Energy will continue to be available at no cost until September 10, 2025. After this date, readers will have the option to subscribe on Substack at a rate of $30/month or $250/year. To subscribe on Substack go to https://josefschachter.substack.com/
Special Note for Schachter Energy Report Subscribers:
If you are a current subscriber to the Schachter Energy Report, you will continue to receive Eye on Energy as part of your Black Gold subscription at no additional cost.
Limited-Time Offer:
From now until September 30, we are offering a special promotion for those interested in becoming Black Gold subscribers. New annual subscribers will receive $100 off their first year. To redeem this offer, enter coupon code SER100 at checkout using the link below:
https://schachterenergyreport.ca/subscriptions/
We sincerely thank all of our readers for your continued interest and support.
Warm regards,
The Schachter Energy Report Team
Global Economic, Political & Military Update
Summary:
President Trump is sending out his unilateral tariff deals. He is giving time for counterparties to come forward (by early August) with better deals that might provide some relief from exorbitant tariffs that would kill or end trade. Any tariff deal over 25% changes trade relations and makes trade nearly impossible.
Crude oil is weakening as demand is sluggish. OPEC’s June increase was not 411 Kb/d but a much lesser number of 220 Kb/d. Global demand is weaker this year due to the economic uncertainties and tight wallets for stretched consumers. We feel that we will see WTI prices below US$60/b in the coming weeks. Today the price of WTI is at US$65.62/b (down from US$67.92/b last week) as global demand wanes and global inventories are building. More on this below.
President Trump is now very frustrated with President Putin for not working to end the war in Ukraine. Instead more deadly drone and missile attacks against Ukrainian civilians are occurring and diplomacy is seeing no progress. Trump thought he had a deal weeks ago and now is making scathing attacks against Putin. Earlier this week he gave him 50 days to move towards a peace deal and ceasefire. If there is no progress he plans on putting 100% secondary tariffs on countries (China and India) that are buying Russian oil. This would remove the funds to keep Russia’s war economy humming. In the meantime North Korea is planning to send 30,000 specialized troops (sappers and construction workers) to Russia to aid it in its war with Ukraine.
The ongoing US stock market rally (new highs for S&P 500 and NASDAQ but not the Dow Jones) has been focused on the AI and tech sectors and is very narrow in leadership. NVIDIA crossed a market cap of US$4T), a new record market cap for any stock. We saw this same gapping up in early February 2025 just before the Dow fell from 45,100 to 36,600 or a decline in 2.5 months of 19%. With sluggish economic data especially in the consumer areas, we suspect we could see a 20%+ general stock market correction (led by tech) over the coming weeks. Caveat Emptor! More on this below.
This week’s Eye On Energy Details:
Current Challenges:
Challenges for President Trump and his administration over his second 100 days will be tough: He needs success on these issues before the end of this timeline:
Be able to fund the current deficit and renew maturing Treasury issues when foreign investors worry about US trade policy and support of NATO. China and Japan have been selling some of their substantial Treasury issues. Near term rates have risen from 4.19% for the 10-Year Treasury to 4.46%. The 2025 high has been 4.82% so if it exceeds that rate market troubles are likely.
Show that he can cut wasteful government spending. The current deficit looks to be US$2.2T for this fiscal year, despite June’s US$26B surplus due to tariff revenues. Markets are watching to see how upcoming Treasury offerings do. So far so good! US Interest rate payments are now over US$1T and could rise much more as the debt raised 2, 3 and 4 years ago was at much lower cost. The renewal will add to the interest cost of this budget.
Trump has announced that he would impose a 50% tariff on copper imports as he works to get more of this critical metal produced in the US (now only 50%). Canada gets smacked down again as Canada exports $4.8B of copper concentrate (99% of US imports). Copper prices jumped and were at US$5.50 per pound yesterday up from US$4.23 per pound just a month ago. Next on Trump’s hit list is the pharmaceutical industry where he plans at a “very, very high rate, like 200%,” if deals are not done to lower US prices significantly.
Get peace negotiations started between Russia and Ukraine and a ceasefire implemented to end the weekly death toll exceeding 5,000 personnel from both sides (military and civilian). The US has pushed NATO countries to cover the needed funds and military equipment for Ukraine. The US will provide the weapons and NATO countries will pay the US for them. Over US$2T of new weapons for Ukraine are being talked about, including Patriot defensive missiles.
Negotiations with China are not moving well and China has put a six-month limit on its ease of rare-earth export licenses to keep pressure on the US. China’s economy is weakening at a fast pace. Industrial profits have fallen 9.1% in May, Mining down 29% and Auto profits down 11.9%. Recent PPI data for China showed deflation as it plunged 3.6% in June from a year earlier. China is now signalling to the US that no trade talks are possible without US concessions on Taiwan. With China agreeing to sell more rare earth scarce critical minerals needed for high tech equipment built in the US, Trump has reversed his decision to hold back sale of NVIDIA and AMD high end semis to China. Those stocks have added to their runs due to this reversal. A bit of progress but not enough
I remain concerned that other Geopolitical Challenges could take place and be the ‘Black Swan’ to take the general stock markets to our downside targets.
Our expected downside targets are:
Dow Jones Industrials Index 35,000 (now 44,104)
S&P 500 4,800 now (now 6,250)
NASDAQ 15,000 (now 20,683)
S&P/TSX Energy Index 230 (now 266)
WTI US$56-59/b (now US$65.62/b – down over US$2/b from last week)
We see WTI rising after the near term dip and the potential issues that could drive prices quite high are:
If Iranian sleeper cells make an attack within the US.
Russia has gathered 110,000 troops near the strategic city of Pokrovsk, a major logistic hub for rails and roads needed by Ukrainian forces in the east of the country. An expansion of the war would bring back a war premium to crude oil. New US secondary sanctions could harm Russian oil sales.
Global growth in late 2025 into 2026 exceeds supplies (Venezuela sanctions impacting as well).
Lack of production growth from the non-OPEC world.
The Trump tariffs are just being seen this month and will be more readily apparent in the stores over the next few months as the tariff levels are firmed up. Both Walmart and Target have warned of the cost of new inventory and much higher prices. Some economists see tariff prices impacting households by US$2,800 by year end. Just think about the cost of clothing, cereals and berries as easy items to see the tariff price impacts. China is now feeling the tariffs and weaker exports of products, hurting energy demand (more on this below).
If you want to see our Action Alert BUYS and our ongoing research on 37 companies in the energy sector then please sign up now for access to the Schachter Energy Research reports.
BULLISH PRESSURE
1. US Tariffs on imports would raise prices for consumers and businesses. We now need to wait for upcoming data to see what occurs. Tariffs on the EU and Mexico are now at 30%.
2. Venezuela sanctions started on May 27th. Production could now fall in coming quarters from over 1M b/d to less than half that number tightening global supplies.
3. Non-OPEC supplies are growing slower than initial expectations.
4. Some OPEC members have not invested to increase their production so any quota increase is meaningless.
5. US crude production fell last week as low prices are starting to have an impact. Production fell 10 Kb/d to 13.375 Mb/d.
6. Houthis are again targeting ships in the Red Sea. Is this at the instigation of Iran?
BEARISH PRESSURE
1.OPEC announced a quota production increase for August of 548,000 b/d. Nice big number but really not realistic. They expected to increase May volumes by 411,000 b/d but only could increase production by 183,000 b/d of which the Saudis increased production by 177,000 b/d. In reality only the Saudis, Kuwait and the UAE could increase volumes but not the number of the quota. The data out yesterday for June shows an overall increase of only 220 Kb/d and not another 411 Kb/d. Yes an increase that lifts global stocks but not glutting markets where prices could fall into the US$50’s as some bears are calling for.
2. Demand weakness in many European OECD economies. Germany and now the UK are in recession. The UK is feeling inflation with tariffs lifting its annual rate to 3.6%.
3. US and China demand for crude and products is not growing and for some products are declining versus 2024 consumption.
4. Kazakhstan continues to increase production from its Tengiz field (operated by Chevron). Production rose to 64,000 b/d in June. They have an OPEC quota of 1.5 Mb/d but are producing at 1.85 Mb/d. OPEC is furious.
5. The US was an exporter of crude 4.52 Mb/d last week. This is up 761 K b/d from 3.96 Mb/d last year.
opec monthly report
OPEC talks about material increases in production but has not been able to raise the volumes forecasted. Instead quota’s are being raised and volumes not so much.
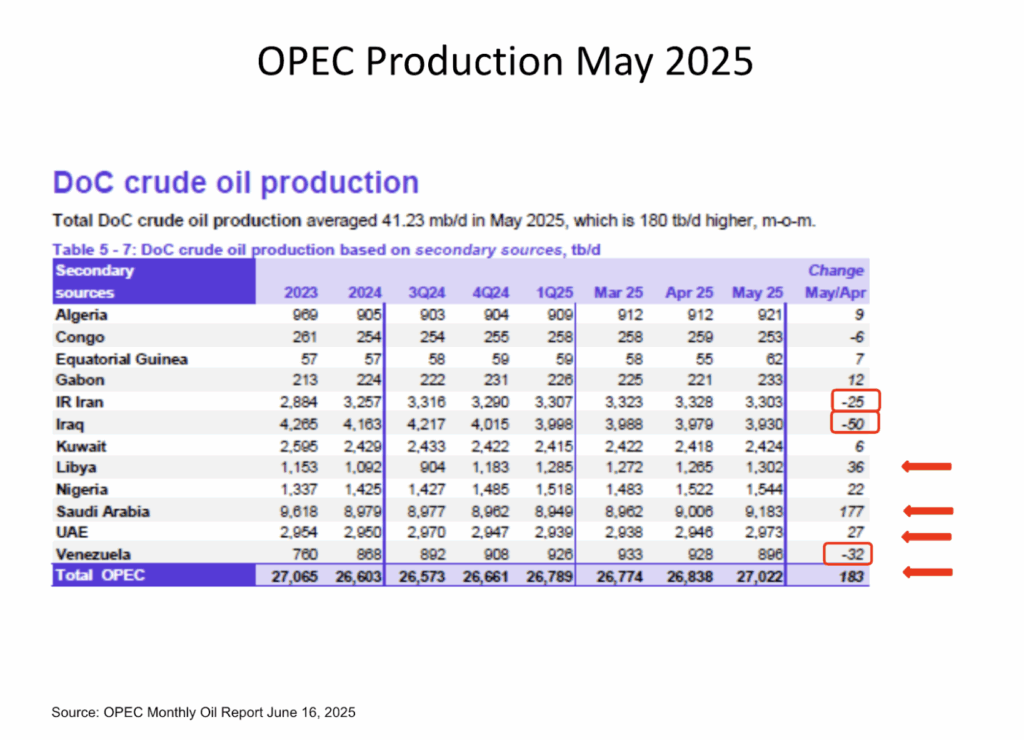
Last month’s May 2025 report was released June 16th and showed that in May OPEC only lifted production by 183 Kb/d and not 411 Kb/d. This smaller increase was due to many countries not investing enough to raise production or were over quota and the new allocation just got them to where they were producing. Only Saudi Arabia and the UAE have real volumes to add. In the month of May, Saudi Arabia added 177 Kb/d and the UAE a modest 27 Kb/d. Nigeria and Libya added volumes but these fluctuate materially due to war disruptions and theft of crude by locals.
Iran produced 3.30 Mb/d for a decline of 25 Kb/d. Iraq 3.93 Mb/d for a decline of 50 Kb/d and Venezuela 896 Kb/d for a decline of 32 Kb/d as US sanctions kicked in on May 27th. I would expect them to lose over 500 Kb/d of production as the sanctions by the US are enforced.
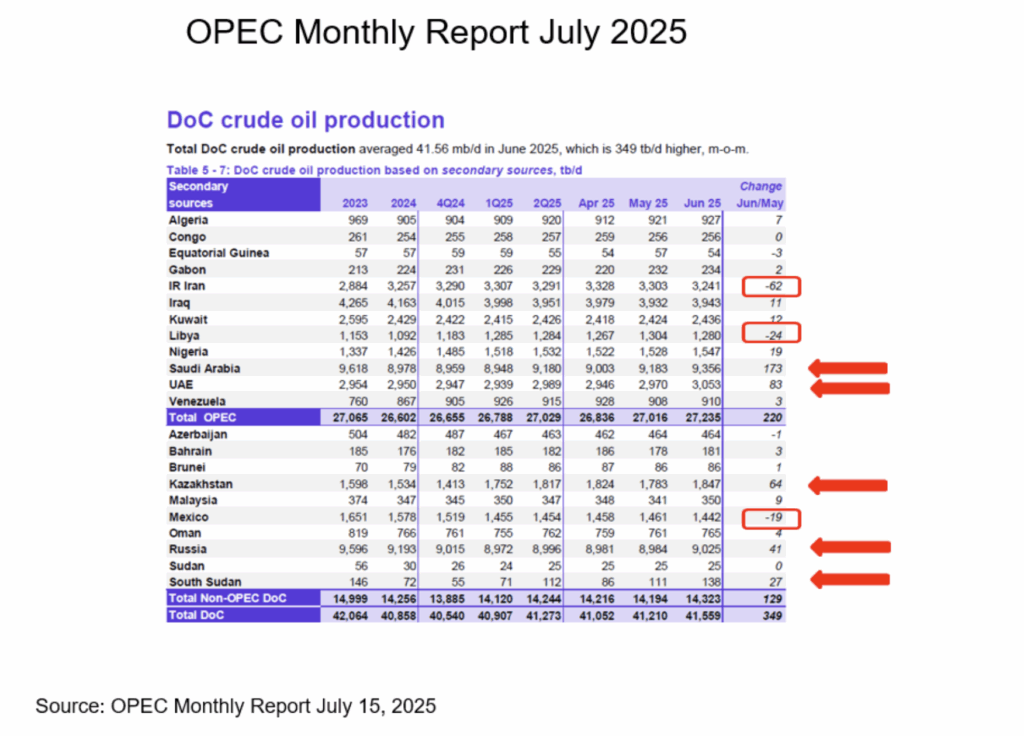
The July 2025 report was released July 15th and showed that in June OPEC only lifted production by 220 Kb/d and not 411 Kb/d. This smaller increase was due to many countries not investing enough to raise production or were over quota and the new allocation just got them to where they were producing. Only Saudi Arabia (+173 K b/d) and the UAE (+83 K b/d) had real volumes to add. Iran saw a decline of 62 K b/d to 3.24 Mb/d due to the war and its aftereffects. Libya saw a decline of 24 K b/d to 1.28 Mb/d due to the ongoing war in the country.
Kazakhstan continues to add volumes. In June it raised production by 64 K b/d to 1.85 Mb/d (above its quota of 1.5 Mb/d). Russia added 41 K b/d to 9.03 Mb/d as China and India continued buying its cheaper oil.
Weakness seen now is tariff and sluggish consumer spending. China, the second largest consuming nation after the US, saw imports fall 0.60 Mb/d to 12.03 Mb/d.
OPEC now sees 2025 demand growth at 1.29 Mb/d or to 105.1 Mb/d consumed in 2025. They see demand rising 1.28 Mb/d in 2026 to 106.4 Mb/d. We see 2025 consumption at 104.5 Mb/d and in 2026 at 105.5 M/d due to tariffs slowing global economic growth. Either forecast means higher crude prices. By 2050 OPEC sees demand at 123.0 Mb/d. That is too far out for us to contemplate.
Crude prices should start to lift in Q4/25 and exceed US$80/b in 2026 as Iran and Venezuela lose production and global demand recovers.
EIA Weekly Oil Data
The EIA data for last week was quite negative as Total Stocks rose 9.0 Mb to 1658.5 Mb, the third weekly increase. Commercial Stocks fell 3.9 Mb to 422.2 Mb while the SPR fell 0.2 Mb to 402.7 Mb. Motor Gasoline Stocks rose 3.4 Mb while Distillate Fuel inventories rose 4.2 Mb. Exports were 3.52 Mb/d but are down from 3.96 Mb/d in 2024. Refinery Utilization fell 0.8% to 93.9% compared to 93.7% this time last year.
US Production fell 10 Kb/d to 13.38 Mb/d but is now only up 75 Kb/d from last year. Overall product demand fell 1.68 Mb/d to 19.18 Mb/d, as Motor gasoline consumption fell by 670 Kb/d to 8.49 Mb/d. Jet fuel consumption fell 298 Kb/d to 1.63 Mb/d. Cushing Inventories rose 0.2 Mb to 21.4 Mb. This is below the 2024 level of 32.7 Mb.
Overall US demand is up modestly from 2025 at 0.5% to 20.09 Mb/d up from last year’s 19.99 Mb/d while Gasoline demand is down for the year by 0.4% to 8.74 Mb/d from last year’s 8.77 Mb/d.
In the coming weeks crude prices should retreat to the low US$60’s and if demand is weak this summer as consumers restrain from travel then we could see a test of the April lows. We expect to get our next BUY signal at that time. In Q4/25 crude prices should lift to US$75/b. Energy related stocks should be great performers as global demand picks up when winter starts and Venezuela sanctions take hold.
EIA Weekly Natural Gas Data
Last week there was an injection of 53 Bcf. This raised storage to 3.00 Tcf with the biggest increase coming in the Midwest area at up 22 Bcf. NYMEX is now at US$3.57/mcf. In 2024 there was a 65 Bcf injection and for the five-year average, injection was 45 Bcf. Lower injections occur at this time of year due to strong air conditioning demand. US Storage is now 5.8% below last year’s level of 3.19 Tcf and 6.1% above the five year average of 2.83Tcf.
We recommend buying the very depressed natural gas stocks during periods of market weakness. Natural gas stocks are very cheap now. We see much, much higher gas prices in Q4/25 as quite a number of new LNG plants come onstream over the next 12 months; one in Canada has now ramped up (first shipment sent to South Korea). In the US Venture Global has commenced production from its Phase 2 of its Plaquemines LNG export terminal in Louisiana. The plant pulled in 2.9 Bcf of feedgas as it filled cargos.
AECO is trading at C$1.20/mcf, a sloppy summer price level. We look for AECO to rise to over C$3.00/mcf in Q4/25 and over C$3.50/mcf during winter 2025-2026. Operators can hedge all of their 2026 production now at >C$3.00/mcf. Higher prices should come as more LNG plants are planned for the BC coast. LNG tankers are being redirected from Asian customers to Europe as prices are much higher there. European natural gas prices are around US$16/mcf (versus US$12/mcf in Asia) as storage is depleting quite quickly. European inventories are low for this time of year’s stock rebuild. Rebuilding storage to the required 90% level by November 1st for winter 2025-2026 will be a big challenge across Europe and should keep import prices high.
Catch the Energy Conference

Registration is Now Open – Join Industry Leaders at the Catch the Energy Conference!
Tickets are now on sale for the public. Become a subscriber and get two free tickets to the conference (tickets to the public are on sale at $119 per ticket each during the early bird window until September 20th (they then move to $179 each). To find out more go to www.catchtheenergyconference.com . We did sell out last year so if you would like to attend please get your tickets as soon as possible.
As usual SER subscribers will receive two complimentary tickets to the event. We look forward to seeing you there!
We are working away on getting our Presenters for this year’s conference. Below are those already signed up with confirmation forms in. We have met with other companies and will update this list as their confirmations come in. We have room for 45 companies and there are some slots still available. SER subscribers always get two complimentary tickets so please put the event in your calendar for October 18, 2025 if you can come to Calgary.
If you know of any companies with great stories and are public companies then have them reach out to me and we can meet them and see if the company would resonate with our attendees. We expect to have over 800 attendees this year versus just over 700 last year. My contact information is josef@sersinc.ca.
We have recently signed up four additional Presenters (Touchstone Exploration, E3 Lithium Ltd., Step Energy Services and Logan Energy Corp.) with more close to sending in their confirmation forms. We intend to have a new ad out in the coming weeks as we complete our Presenter line-up. We are focused on having our program completed during the summer. Our attendance marketing has just started.
Thank you to our Sponsors, Exhibitors and Presenters. It is going to be a great lineup and largest attendance this year!
Baker Hughes Rig Data
In the data for the week ending July 11th, the US rig count saw a decrease of 2 rigs to 537 rigs. US Rig activity is now 8.0% below the level of 584 rigs working last year. Of the total US rigs working last week, 424 were drilling for oil and this is 11.3% below last year’s level of 478 rigs working. The natural gas rig count is up 8.0% from last year’s 100 rigs, now at 108 rigs. Companies remain financially disciplined despite the Trump administration edict to ‘drill baby drill’. WTI will need to exceed US$80/b for some time before drilling activity picks up materially for crude production to reach new all time highs. Natural gas needs to be over US$4.00 for NYMEX to incentivize natural gas drilling activity on a consistent basis. President Trump is in glee over the lower price of crude and lower gasoline prices; one of his election promises. In Canada, there was an 11 rig increase to 162 rigs. This rig activity rate is now down 14.3% compared to last year’s 189 rigs. There were 112 rigs drilling for oil last week down 11.1% from 126 last year. Drilling for natural gas was down 20.6% from 63 rigs to 50 rigs.
Energy Stock Market
The S&P/TSX Energy Index today is at 270. The energy sector is beginning to retreat from its mid-June high of 286 and I expect a further 10-15% correction.
We like to BUY when stocks are cheap and being ignored. Bargains are clearly being seen now. Late July should provide the next great window to add to favourite positions at prices 10% lower than today. Investors should decide what you want your energy weighting to be for this long energy super cycle. Our BUY List includes ideas from the Pipeline/Infrastructure/Royalty area, Canadian oil and natural gas ideas, energy service ideas and companies working internationally. Our list includes large Conservative ideas and small to large caps in our Growth and Entrepreneurial categories. Add to your current ideas or add new ideas. We expect global demand should exceed supplies at that time. We see WTI prices above US$75/b consistently during 2026.
We are working on our next SER Monthly that should be out to paid SER subscribers July 17th. It will include company updates on two companies, one of which is completing a major transformational acquisition. If you are interested in independent analysis of the energy sector and to see our Balance of Evidence sections then become a subscriber. https://schachterenergyreport.ca/subscriptions/
CONCLUSION
Down market days for energy stocks are the best days to build your positions for the lengthy energy super cycle we see lasting into the end of the decade. Subscribe now so you don't miss it!
We see energy having a very rewarding period for investors into year end from upcoming lows. Some of the BUY ideas we show on our SER Recommendation List could see upside of 50% or more into year end if our call of over US$75/b post war occurs.